Hi, I'm Kate.

tech lead, iOS developer,
product manager, data nerd
and wine enthusiast.

Projects
About
Contact
Designed & Implemented By Kate (Willison) Jonason © 2017

PROJECTS

winefox app preview

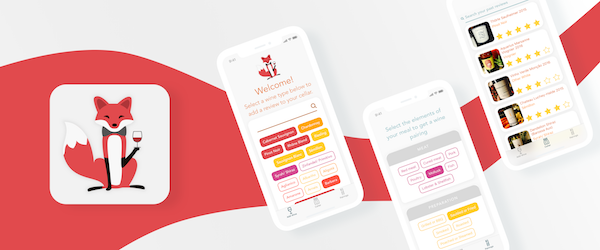
WineFox - A wine pairing, learning and note-taking app

I built the first version of WineFox back when I was the Vice President of the Stanford Wine Society. My goal was originally to give members a handy way to take blind-tasting notes according to "the grid", while at the same time providing a comparison to classic expressions of various grape varietals in order to make it easier to guess what was in the glass.

Realizing this audience was maybe a little niche, I set out into the wine shops and grocery stores around town to interview users "in the wild" about how they go about selecting a wine, and distilled those insights into a host of new features (pairing suggestions, sharing ratings, etc) aimed at engaging a broader wine-appreciating public. At the same time, I wanted to keep the essence of blind-tasting in the rating feature in order to nudge users towards a more mindful tasting experience, with the ultimate goal of providing a means to make e.g. "Mosel Riesling" evoke as vivid a flavor profile as "Baja fish tacos". There's tons I'd still like to do of course, but as always, only so many hours in a day!

Follow WineFox on Twitter or download for free on the App Store.

stockholm apartment preview

Parsing Stockholm Apartment Data

After moving back to Stockholm in 2016, we were looking for a place to live, and I happened to stumble upon Booli's most excellent API, so just couldn't help throwing together some quick visualizations to help make a bit more sense of the apartment market 🤓🏡 Check it out here!

Less for flexitarians screenshots

Less – a tool for flexitarians

I built Less (available on the App Store) in order to help aspiring vegetarians and flexitarians track their meat consumption over time. While there are a range of benefits to eating less meat (from lower cholesterol to boasting rights over the smaller environmental impact of your diet), many people find it difficult to meaningfully cut down on meat consumption without adhering to a plan that robs the joy from their dining experiences. Did your friends plan an after-work BBQ on Wednesday? Too bad you only eat meat on the weekends!

Enter Less, which allows you to set a rolling 7-day consumption limit, and then hold yourself to it with single-tap meal logging. The app includes plenty of breakdowns on your data over time and by meal type, as well as the ever-popular streak count for that extra motivation to stay within your target. Follow Less on Twitter or download for free via the App Store.

wine explorer preview

The Wine Explorer

Originally the product of a final project for CME 161: Data Visualization at Stanford (which I then developed a bit further), The Wine Explorer is an interactive tool that leverages D3 and crossfilter.js in order to let users filter wine varietals by aroma, color, region, body, acidity etc. The end product is useful both in blind tasting (wherein you use the wine’s characteristics in order to guess its varietal, age and origin) as well as simply deciding what bottle to buy if you have a particular taste in mind.

machine learning visualization preview

Machine Learning applied to Blind Tasting

As a final project for Stanford’s CS 229 course on Machine Learning, our team built a classification model for 23 common wine varietals based on the descriptors in a dataset of 30,000+ professional wine reviews. Our preliminary Naïve Bayes model exhibited high variance, which we chose to counter by simplifying the feature set, stemming the descriptors in each review (so that e.g. ‘jam’ and ‘jammy’ would map to the same feature), and then using (unsupervised) Latent Dirichlet Allocation to build a 20-category topic model in order to select the most relevant features across all categories. The learning curves from a 10-fold cross-validation indicated that the best balance between over and under-fitting the model was achieved by using the top 5,000 relevant features from the LDA analysis.

The resulting Naïve Bayes model had a 68% testing accuracy for the 23 varietals in our dataset – rather impressive compared to the naïve baseline of 1/23 ≈ 4.3%. Additionally, the varietals present in the categories created by the unsupervised LDA analysis, as well as the salient descriptors for each, gives us a means to approximate varietal proximity, i.e. what wines are similar to each other and in what way (aroma, acidity, etc). All in all, it was a very exciting project to work on, in large part because it involved two of my favorite things: data and wine! Checkout the writeup for more juicy details.

post-it wall shadowing users prototype screenshot

Civis onboarding

In the summer of 2015, Civis Analytics was on the verge of launching their new data science platform. Originally a custom-built solution used to target voter outreach efforts in Obama’s 2008 and then 2012 campaigns, the analytical workflow they had created was increasingly more broadly applied to both public and private sector data challenges, and its web application front-end meant that the tool could now be used by data scientists and less skilled analysts alike. The challenge we were presented with (myself as the Product Manager, and my fellow intern Deana Rutherford as the UI Designer) was to create an onboarding experience that would serve to orient data scientists to the tools they expected to find, as well as to introduce analysts to a potentially unfamiliar data science workflow and its associated tools.

Our process started by shadowing a handful of new users through a few different tasks, e.g. importing a dataset, selecting a chunk of data using SQL on the platform, and building a model. As you might expect, this gave us a ton of insight into the new user experience, and a lot of little UI ‘bugs’ to squash in parallel with crafting the larger onboarding experience. In true d.School style, we then synthesized our observations into a rainbow of say/do/think/feel post-it notes centered around the different areas of the platform, and the connections between them (or lack thereof). Armed with these observations, we set off into a week-long Google design sprint, where we sketched, prototyped, tested and iterated our way through a few designs before creating a final spec and high-fidelity clickable prototype to hand over to the dev team. At the end of the summer, we gave a presentation about the new user experience and our proposed onboarding walkthrough, and synthesized our findings into a digestible “customer journey map” for Civis to use in feature prioritization going forward.

ABOUT

about image #2 about image #1 about image #3 about image #5 about image #4

A little bit about me

Hi there! I’m Kate. Born and raised in the heart of Silicon Valley, California, it comes as no surprise that many of my favorite things are the best of what my home state has to offer: great hiking, great wine, and great user-centric mobile and web applications. I enjoy analyzing a dataset almost as much as I enjoy analyzing a good glass of Old-Vine Zinfandel, and where those two passions intersect is most definitely my happy place (which might be obvious from the ‘Projects’ section above). Apart from that I love to travel – not so much for relaxing as for adventuring, learning new languages and experiencing new cultures.

In both my studies and my work I’ve aimed to balance crucial technical know-how with a strong user sensibility. I started learning humans and machines from the bottom up in my undergraduate years at UPenn, focusing on cognitive neuroscience and test-driven development. In my graduate education at Stanford, I built on this foundation by honing my design thinking skills at the Stanford d.School, as well as my technical toolkit through courses in machine learning, systems engineering, and iOS & web development. After earning my MS, I skipped town and traveled over-land from Stockholm to Saigon, through Estonia, Russia, Mongolia, China and Vietnam by train, bus, boat, and motorcycle. 4 months and 19,628 kilometers later, I headed back in Stockholm and onto my next adventures!

CONTACT

tile closeup

Want to get in touch? Shoot me an email or message me on LinkedIn and I’ll get back to you as soon as I can.